
Performance Mode
Last Updated: 12 Jan 2017
Performance Mode analyses the load time of assets within the system, presenting the results of these analyses on in-depth timeline charts.
Users can employ this tool to monitor the performance of the assets within their system. Performance Mode is especially useful in locating problem areas or assets that may be causing excessive load times, allowing users to identify and resolve any performance issues.
Users need to have at least Write Access to the Asset they want to run Performance Mode on and must have access to Admin Mode.
Accessing Performance Mode
You can access Performance Mode by appending _performance to the URL of an asset, like this:
http://www.example.com/site/_performance
When Performance Mode is first accessed, Squiz Matrix will analyse the performance of the assets loaded on the URL. Once the performance of your asset has been analysed, the results of this analysis will be displayed at the bottom of your browser.
While all assets can be analysed in Performance Mode, only supported assets loaded on a URL will be displayed in the performance results. The following asset types are currently supported for detailed analysis in Performance Mode:
- Asset Builder Page *
- Asset Listing Page *
- Calendar Page
- Custom Form
- Data Source assets
- Designs and Design Customisations
- Paint Layout
- Remote Content
- Search Page (incl. Search Manager) *
- Standard Page
- Content Containers
- Triggers
- REST assets
* Also supports individual asset step analysis. For more information, refer to the Asset Steps section in this chapter.
You can continue to navigate around your Site while in Performance Mode. Each time you load a new asset, it's performance will be analysed and the results displayed in your browser.
Performance Mode Interface
The Performance Mode interface is comprised of the Total Time, System and Queries fields; the Caching and User buttons; the Asset Count and Slowest Loading Assets fields; and the Performance Results Graph.
An example of the Performance Mode interface is shown below.
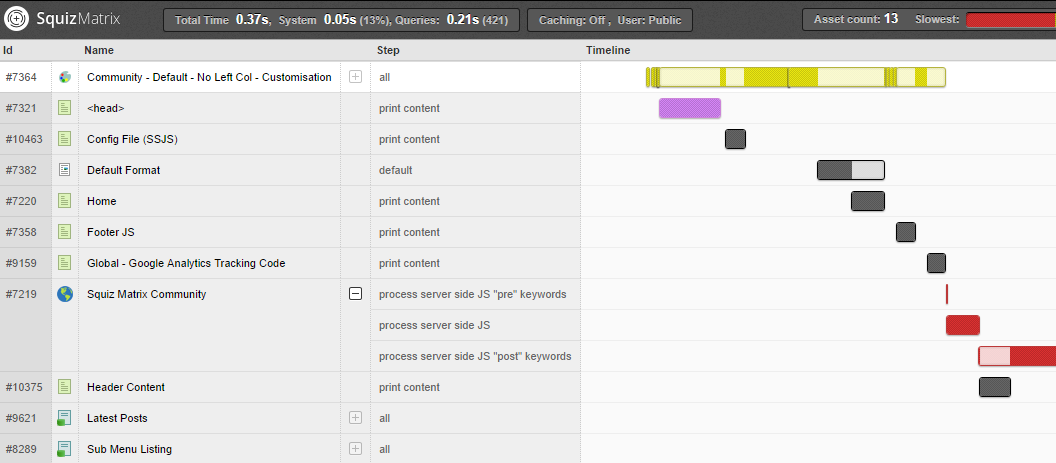
Total Time, System and Queries Fields
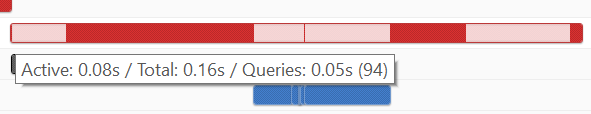
The Total Time field displays the total time taken to load your asset. The System field indicates what portion of this time can be attributed to system processing; the remaining time is attributed to individual asset loading.
The Queries field displays the total time taken by queries run on the loading of the asset , as well as listing a count of the total number of these queries.
Caching and User Buttons
The Caching button allows you to monitor the performance of your asset using its default cache settings and when cache is disabled. This allows you to examine the impact of caching on your assets.
To switch the caching method, click the Caching button. The asset will be re-analysed with the new caching method and the performance results displayed.
Similarly, the User button allows you to switch between viewing the performance of the asset viewed as the default user (the user currently viewing the asset) and when viewed as a Public User.
To switch the user type, click the User button. The asset will be re-analysed with the new user type and the performance results displayed.
If you change the User or Caching setting, these settings will be maintained as you navigate through the assets in your Site.
Asset Count and Slowest Loading Assets Fields
The Asset Count field lists the total number of assets that have been loaded and analysed within the Performance Mode results, while the Slowest field displays a graphical measure of the slowest five assets to load.
Hovering over each segment of this bar will display the name, load time and number of queries run for the corresponding asset, as shown in the example below.
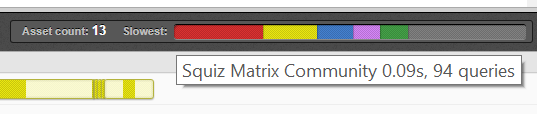
The five assets that take the longest time to load will be highlighted in the Performance Results Graph with the colours specified in this bar (i.e. the slowest asset will be red, etc.). For more information, refer to the Performance Results Graph section, below.
Performance Results Graph
The Performance Results Graph displays a list of the analysed assets on the URL, alongside a graphical timeline of the loading of these assets.
On the left side of the Performance Results Graph, the asset's loaded on the URL will be listed in chronological order. For example, in the graph below, our Community - Default - No Left Col - Customisation Design Customisation is the first analysed asset to be loaded on this particular URL.
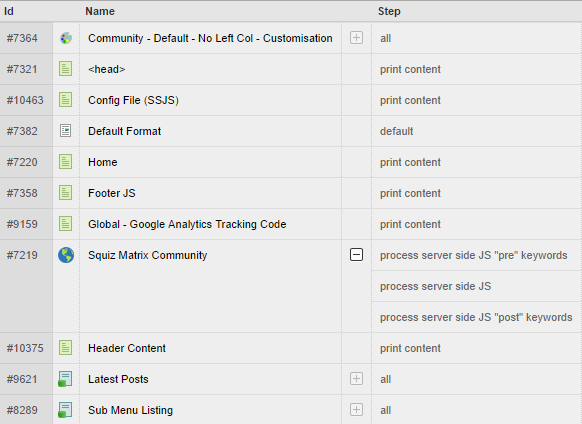
For each listed asset, the asset ID, asset type, asset name and Step type will be listed. For more information on the Step type, refer to the Asset Steps section below.
On the right side of the Performance Results Graph, a timeline is displayed. A performance bar is shown on this timeline for each individual asset loaded on the page, graphically outlining the total load time of the asset.
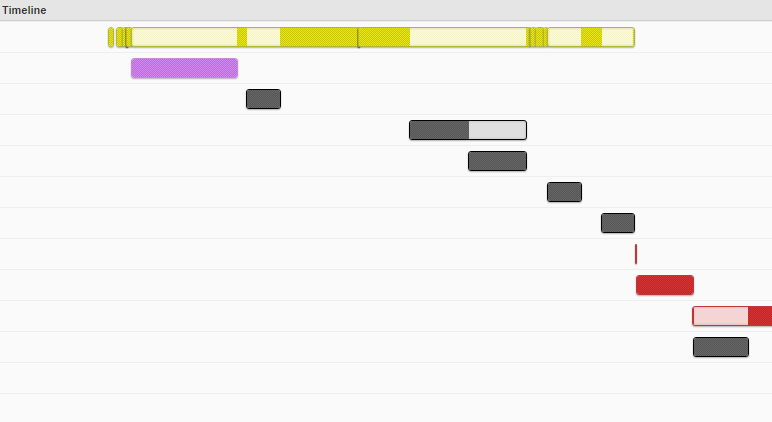
These performance bars are presented as a series of dark and light segments, indicating when the asset was actively loading (dark) and when the asset was idle, due to other loading assets (light). The colour of each bar is determined by the total load time of the asset, as outlined in the table below.
| Performance Bar | Colour | Status |
|---|---|---|
| | Red | Slowest asset to load. |
| | Yellow | 2nd slowest asset to load. |
| | Blue | 3rd slowest asset to load. |
| | Purple | 4th slowest asset to load. |
| | Green | 5th slowest asset to load. |
| | Grey | Not among slowest loading assets. |
A graphical representation of the five slowest loading assets is displayed in the Slowest field. For more information, refer to the Asset Count and Slowest Loading Assets Fields section in this chapter.
Hovering over an asset's performance bar will display the total and active load times for that specific asset, as well as the run time and total number of queries on the asset.
Asset Steps
Some asset types, such as an Asset Listing Page, can contain multiple steps during loading. Performance Mode allows you to break these assets down and analyse the individual performance of each step.
To expand an asset, click on the Plus icon in the list of analysed assets. The asset will be broken down into its individual load steps, as shown in the example below. This will also section the performance bar of the asset into individual steps.
Understanding the Performance Results
The results returned in Performance Mode are presented in a format that allows you to identify which assets in your system are causing the largest drain on performance and at what point during the asset's load time this is occurring. The following example (click to enlarge) will explain how to interpret and utilise these results.

In this example, our URL is taking a total of 0.54 seconds to load, with 0.46 seconds (76%) attributed to individual asset load time.
The colours of the assets on the performance Timeline indicate which assets took the longest time to load.

The Design Customisation of the page (asset #698) is coloured red, as it has taken the longest amount of time to load. The second longest asset to load was the Section Image Asset Listing Page (#666), in yellow, followed by the Standard Page Format Paint Layout (#950), in blue; the Right Content Asset Listing Page (#921), in purple; and the Scripts - Global Standard Page (#174), in green.
Looking at the Timeline, we can observe that asset #698 begins actively loading first. It is then idle for a short time while asset #174 loads - nested JavaScript content in the Design. The asset then continues loading for a significant length of time. This large amount of active load time can be attributed to the rendering of the main navigation menu and search bar Design Areas of our asset's Design.
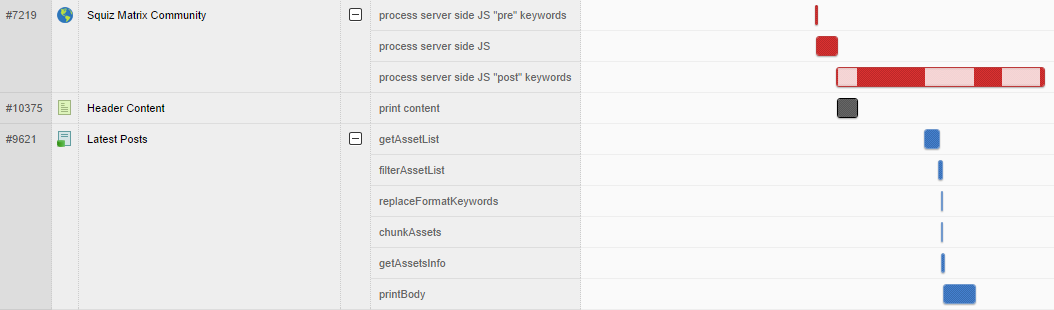
The Design Customisation is again idle while asset #666 loads. This asset is a nested Asset Listing Page that prints the cartoon figure in the asset's Design and is the second slowest asset to load.
Expanding the Asset Listing Page tells us that the getAssetList and printBody processes are taking the longest amount of time to load, while the filterAssetList, groupAssets and chunkAssets load time is minimal.
Once this listing loads, the Design Customisation renders the Design Areas displaying the asset lineage and sub-menu. After this, asset #950 - a Paint Layout nested in the Design - is loaded. This asset prints the content of the current asset (#509), as well as asset #921, an Asset Listing Page on the right side of the page.
This Asset Listing Page prints the content of asset #944 during its printBody step, seen when we expand the listing on the performance Timeline, as shown in the figure below.

Analysing the Asset Listing Page's individual steps
Once the main content of the page is loaded, assets #657 and #2197 load. These assets contain the footer content of the page and a simple Easy Edit Suite JavaScript plugin; they are not significant to the overall load time of the URL.
From these results, we can distinguish that the biggest hits to performance on this URL are the loading of the search bar and main menu Design Areas on the Design Customisation and the Asset Listing Page, listing the cartoon figure.
If we were dissatisfied with the total load of the URL, we would know to target these areas when attempting to improve performance.