
Analytics Screen
Last Updated: 28 Jun 2023
This entire manual refers to a feature that was added in version 5.1.0.0
The Analytics screen displays analytics data of your site via an established connection with a Google Analytics application.
This screen will only appear if a connection to Google Analytics has been established and integrated with your Edit+ for Squiz Matrix installation. For more information, refer to the Google Analytics manual.
As of July 1st, 2023, the Google Analytics Connector and Google Analytics View in Matrix 5 Edit+ will no longer be compatible with or support Google Universal Analytics (UA). This is due to the announcement by Google that its next-generation analytics platform, Google Analytics 4 (GA4), will replace the Universal Analytics (UA) properties on July 1, 2023.
Overview
The data available on the Analytics screen is broken down into four tabs: Summary, Traffic, Audience and Goals . Each of these tabs contains a variety of widgets and reporting tools to present the data being retrieved from Google Analytics.
Google Analytics data on this screen is generated daily via the Generate Google Analytics Report Scheduled Job in the Scheduled Jobs Manager. For more information, refer to the Scheduled Jobs Manager chapter in the System Management manual.
At the top right of this screen, you can select to display data from the past 1, 3 or 6 months. The date range of the reported data will be displayed below.
If no data has yet been generated for the current page, you can click on the Refresh button to start the generation of fresh data. This will start a process that fetches the latest analytics data directly from Google Analytics. Once the data has been retrieved, it will be displayed in the section below.
Please note that clicking Refresh will only refresh the data for the current time period you have selected.
The data accumulated of a particlar asset is based on the URL of that asset. This will also include any combinations of that URL for hits that include URL query strings. For example, if you have had traffic under the following URLs:
- https://matrix.squiz.net/asset
- https://matrix.squiz.net/asset?page=1
- https://matrix.squiz.net/asset?utm_campaign=spring&utm_medium=referral&utm_source=exampleblog
The analytics data shown for the asset with the https://matrix.squiz.net/asset URL will include data from all 3 URL variants.
If your page has multiple URLs, you can select the URL to view the analytics data of via the URL drop-down list.
Summary
The Summary tab provides an overall summary of the Google Analytics data of your page, including page views and session details. An example of the information displayed on this tab is shown below:
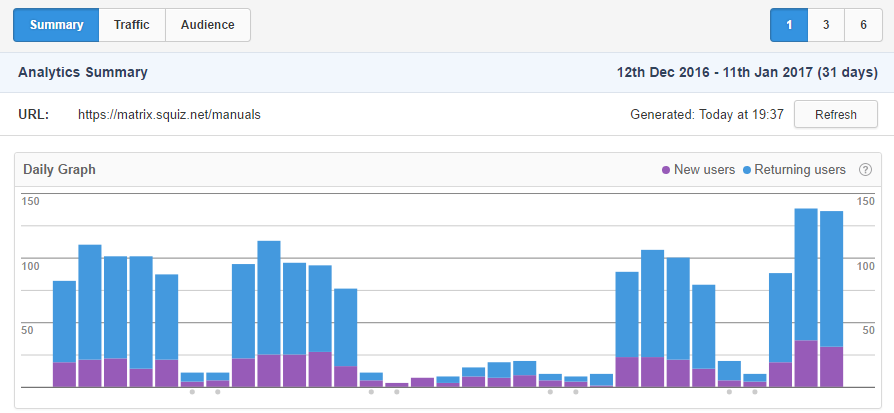
The following data will be displayed on this tab:
- Daily Graph: A graph displaying the total number of sessions that visited the current page each day.
- Sessions: The number of users who viewed the current page at least once in a session.
- Page Views: The total number of times the current page was viewed.
- Average View Duration: This average time spent viewing the current page.
- Landings: The total number of sessions where the current page was used as the landing or entrance page.
- Bounce Rate: The percentage of landings where the current page was the only page a user interacted with in a session.
- Exit Rate: The percentage of page views where the current page was the last page a user interacted with in a session.
- Page Speed: The average length of time it took for the current page to load (based on a random same of page views).
- Device Usage: The percentage of sessions that visited the current page at least once, broken down by the device used (desktop, tablet or mobile).
- Internal Referrers: The pages inside the current site that were most viewed as the page immediately previous to the current page.
- External Referrers: The top referring sites to sessions that viewed the current page at least once.
- Top Campaigns: Top tagged campaigns for sessions that viewed the current page at least once, ordered by the number of sessions.
Traffic
The Traffic tab provides Google Analytics data of the web traffic to your asset, including sources and referrers. An example of the information displayed on this tab is shown below:
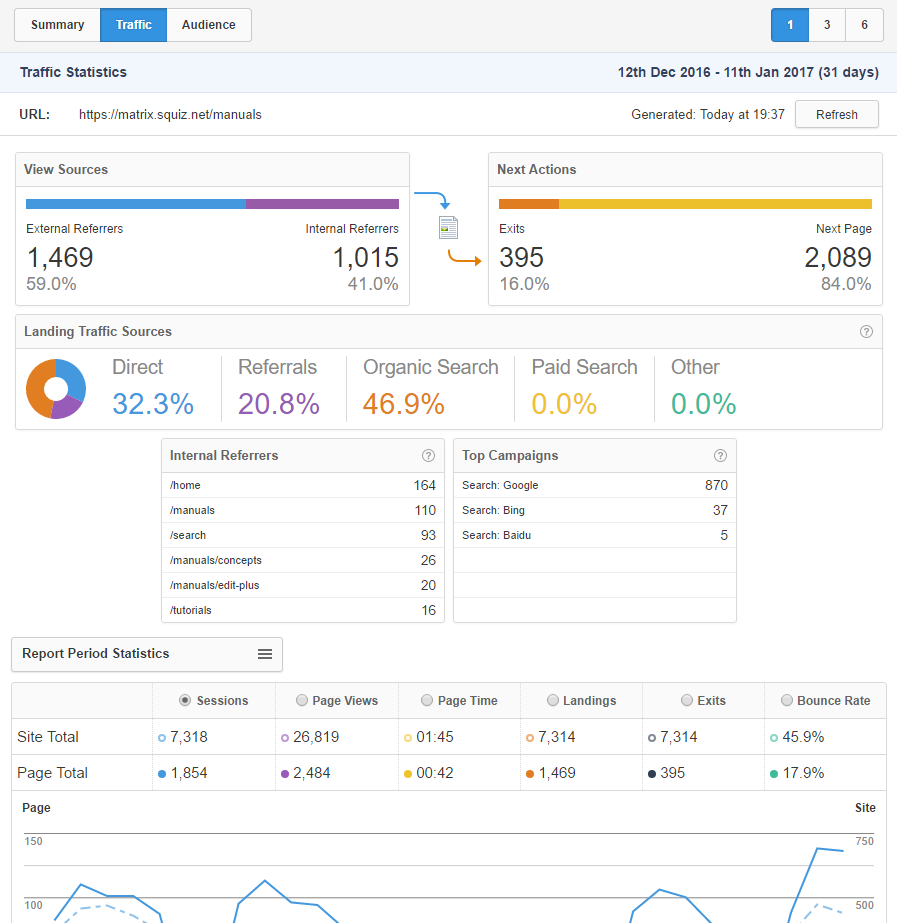
The following data will be displayed on this tab:
- View Sources: A graph displaying the total number of page entries, broken down into external and internal referrers.
- Next Actions: A graph displaying the total number of page exits, broken down into site exits and next page views.
- Landing Traffic Sources: Referral source breakdown by the type of source.
- Internal Referrers: Top number of pages that referred users to this page.
- Top Campaigns: Top tagged campaigns, ordered by the number of sessions. Campaigns include traffic sources other than referrals and direct traffic.
The drop-down menu at the bottom of the Traffic tab, allows you to view the following additional analytics data:
- Report Period Statistics: A graph displaying a list of traffic statistics for the specified report period. You can click the statistic headers to show and hide this data on the graph. The following information is available to view:
- Sessions
- Page Views
- Landings
- Page Time
- Bounce Rate
- Exits
- Top Referring Sites: A graph displaying a list of the top referring sites for the current page. For each site listed, the following information is available:
- Sessions
- Page Views
- Page Time
- Bounce Rate
- Top Referring Pages: A graph displaying a list of the top referring pages for the current page. For each page listed, the following information is available:
- Sessions
- Page Views
- Page Time
- Bounce Rate
Audience
The Audience sub-screen provides Google Analytics data on the users who have viewed the current page, including countries and cities they are from, and which operating system and browsers they are using. An example of the information displayed on this tab is shown in the figure below:
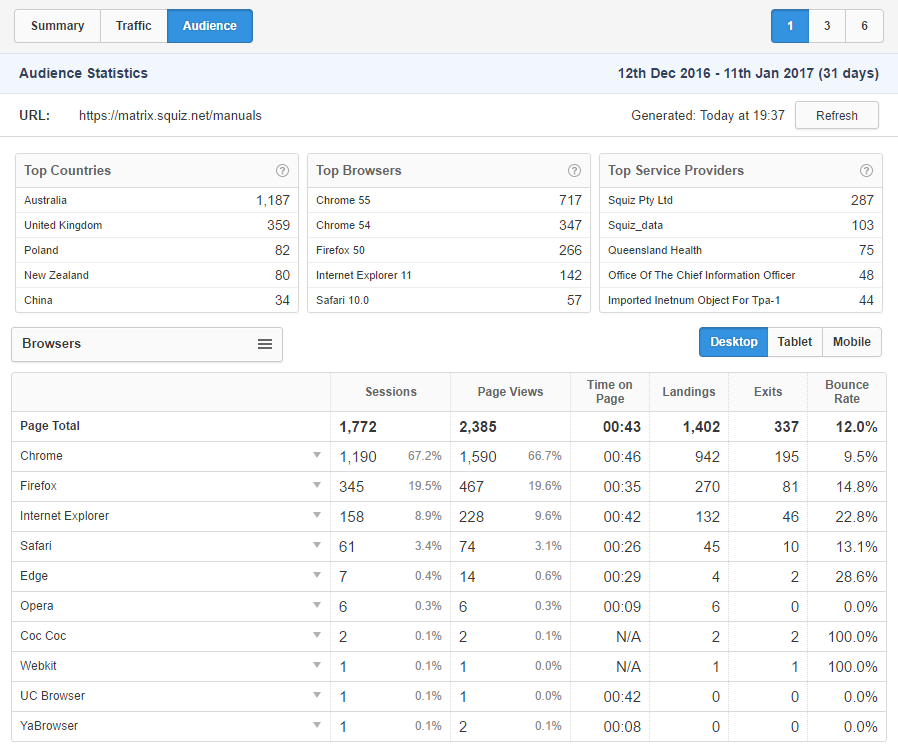
The following data will be displayed on this tab:
- Top Countries: Top country locations of users that visited this page.
- Top Browsers: Top used browsers used by users that visited this page.
- Top Service Providers: Top service providers of the users that visited this page.
The drop-down menu on this screen allows you to display the analytics data available. The following information is available:
- Language: A list of languages of users who have viewed the current page, derived from from the browser locale. For each language listed, the following information is available:
- Sessions
- Page Views
- Page Time
- Bounce Rate
- Location: A list of locations that users who have viewed the current page are from. When this option is selected, a new field will be displayed, allowing you to toggle between viewing a list of Countries or Cities. For each location listed, the following information is available:
- Sessions
- Page Views
- Page Time
- Bounce Rate
- OS: A list of the operating systems used by users who have viewed the current page (i.e. Windows, Macintosh, Linux). When this option is selected, a new field will be displayed, allowing you to toggle between viewing the OS list for either Desktop, Mobile or Tablet users. For each OS listed, the following information is available:
- Sessions
- Page Views
- Page Time
- Bounce Rate
- Browsers: A list of the browsers used by users who have viewed the current page. When this option is selected, a new field will be displayed, allowing you to toggle between viewing the OS list for either Desktop, Mobile or Tablet users. For each browser listed, the following information is available:
- Sessions
- Page Views
- Page Time
- Bounce Rate
- Devices: A graph displaying the number of sessions for both the current page and the site, broken down by device, i.e. Desktop, Tablet or Mobile. You can click the device headers to show and hide this data on the graph.
- Service Providers: A list of the organisations of users who have viewed the current page. For each organisation listed, the following information is available:
- Sessions
- Page Views
- Page Time
- Bounce Rate
Goals
The Goals tab provides Google Analytics data on the goals that have been set up for your system. Goals allow you to measure the success of specific website objectives, such as visiting a specific page, clicking on a particular link, or buying a product from an e-commerce shop.
The Goals tab is only available when viewing the Analytics screen on the Site asset or the Google Analytics View asset because this information is based on data gathered from the whole website rather than individual pages.
For more information on goals and how to set them up, refer to the Google Analytics documentation.
By default, a summary of the goals data for your site will be displayed on this tab. The drop-down menu available allows you to view individual goal statistics.
The types of goals available are as follows:
- Destination - Direct: tracks visitors who visit a specific page on your site.
- Destination - Funnel: tracks visitors who visit a specific set of pages on your site.
- Duration: tracks visitors who spend a certain amount of time on your site.
- Pages/Screens Per Session: tracks visitors who view a certain number of pages per visit.
- Event: tracks visitors who perform custom actions on your site.
For each goal, the following information will be displayed:
- Conversion Rate: the percentage of goal conversions that took place during the selected time period.
- Funnel Abandonment Rate: the percentage of sessions which reached a step of a Destination (Funnel) goal but not convert it. It is shown in the chart as a proportion of total sessions, to allow comparison with the number of conversions.
- Conversions: the total number of goal conversions that took place during the selected time period. The possible number of conversions is the number of goals multiplied by the number of sessions.
- Conversion Value: the total value of goal conversions, based on the value of each goal (and view currency), taken from your Google Analytics' settings. For Event Tracking goals, a value can also be set when the event is triggered.
A Daily Conversion Graph will also be available, displaying the total number of goal conversions by day, divided by whether the user was a new or returning visitor to the site.
If you are viewing the Goal Summary statistics, information on the Traffic Sources, Device Usage and User Type of your goal conversions will also be displayed.
If you are viewing an individual goal, a drop-down will be displayed allowing you to view the following information:
- Session Statistics
- Page Views
- View Duration
- Page Speed
- Device Usage
- Traffic Sources
- External Referrers
- Top Campaigns
- Most Viewed Pages
- Top Conversion Pages
Website Analytics Data
When you view the Analytics screen of an asset it will show you data from that page's URL. You can see a report of analytics data from the whole website by viewing the Analytics screen of the Site asset or the Google Analytics View asset.
When you view the Analytics screen on these assets, the same tabs and information will be available for you to view. The difference will be that the information displayed will be of data gathered from all pages of your website that has Google Analytics tracking enabled.
Homepage Analytics Data
When you view the Analytics screen of the Index asset that has been assigned to your Site asset, it will show you data from both the Index asset's URL as well as the Site's URL.
For example, let's say the URL of your Site domain was https://matrix.squiz.net and the URL of your Index page was https://matrix.squiz.net/home. If you viewed the Analytics screen of the Index page asset, it would show you data from both URLs combined.